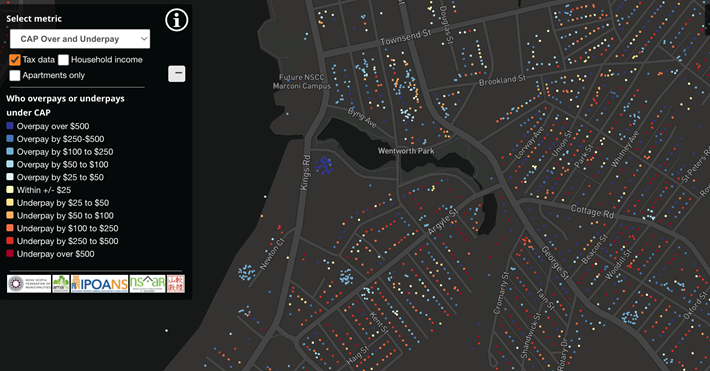
Nova Scotia residential property tax assessment increases of owner-occupied homes are capped to inflation. People who have continuously owner-occupied their home pay lower property taxes compared to renter-occupied homes, owners who bought or moved in recently, or compared to people who have rented out their homes for more than a year.
The interactive map focuses on residential properties. If a property has multiple uses besides having a residential use, for example mixed commercial and residential uses, this map shows the assessed value and tax rates of the residential portion only. It will also show the resource portions attached to residential properties that are taxed based on assessed values.
CLICK HERE TO ACCESS THE INTERACTIVE MAP


2
Log In or Sign Up to add a comment.- 1
arrow-eseek-e1 - 1 of 1 itemsFacebook Comments