The results are in and they are particularly favourable for two candidates.
Note that this poll did not ask who you will vote for. It only asked about the suitability for the role of Mayor. Our methodology is explained below.
The Data
- Nearly 500 entries were processed, providing a meaningful sample size that could represent as many as 1% of voters. The poll was online and anonymous and open for 8 days between Sep 26 to Oct 3, 2024.
Risks
There are two risks with anonymous online polls:
- Bad actors may attempt to manipulate the results by submitting the poll multiple times. They may attempt to do so manually or with automation (bots). And they may try to conceal their efforts by using multiple devices, locations, or proxy servers. We are aware of these tactics and were prepared for them. We did a manual (human) review of the data and we used automation with AI to further validate the results. While no method is foolproof, we believe the results are reasonably valid. Our analysis identified 41 suspicious entries out of 535, with no particular pattern of support for any one candidate. These entries were removed — but have little effect on the overall results.
- Candidates who are more well known and liked and/or more active on social media typically have an advantage with online polls. While this may skew the results, it is fair play and common with elections. The only way to mitigate this is for participants to be randomly selected — but this typically means the poll will not be anonymous and that carries its own risks.
Your Vote
Keep in mind that this is just an opinion poll. If you like, dislike, agree, or disagree with the results, the only true action that makes a difference is your vote during the election — so be sure to vote.
Poll Results
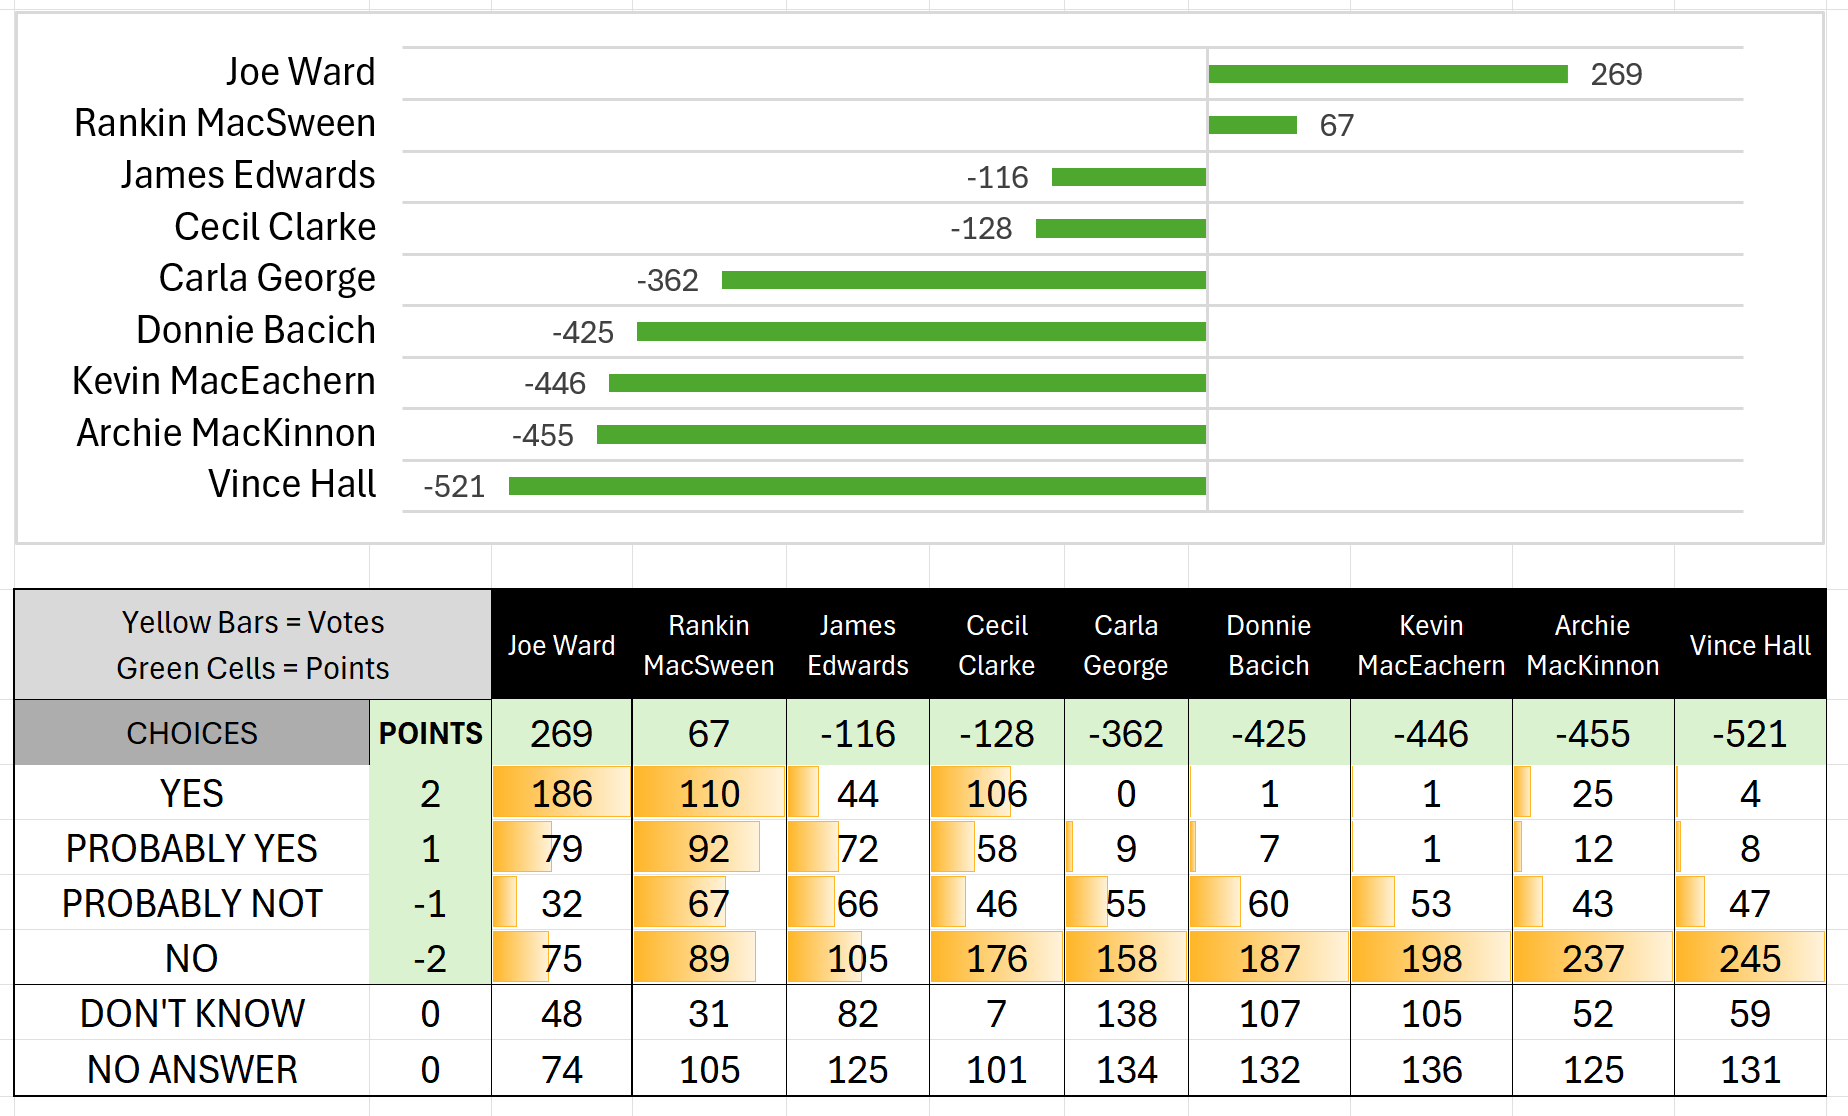
(Q1) Will the candidate be a GOOD Mayor?
- To tally and chart the results, we assigned points to each response:
- YES = 2
- PROBABLY YES = 1
- PROBABLY NOT = -1
- NO = -2
- DON’T KNOW and NO ANSWER = 0
- Total POINTS earned are in the green row in the table below and shown on the bar chart.
- The numbers with the yellow bars are the quantity of responses received (e.g., the number of YES responses, the number of NO responses, etc).

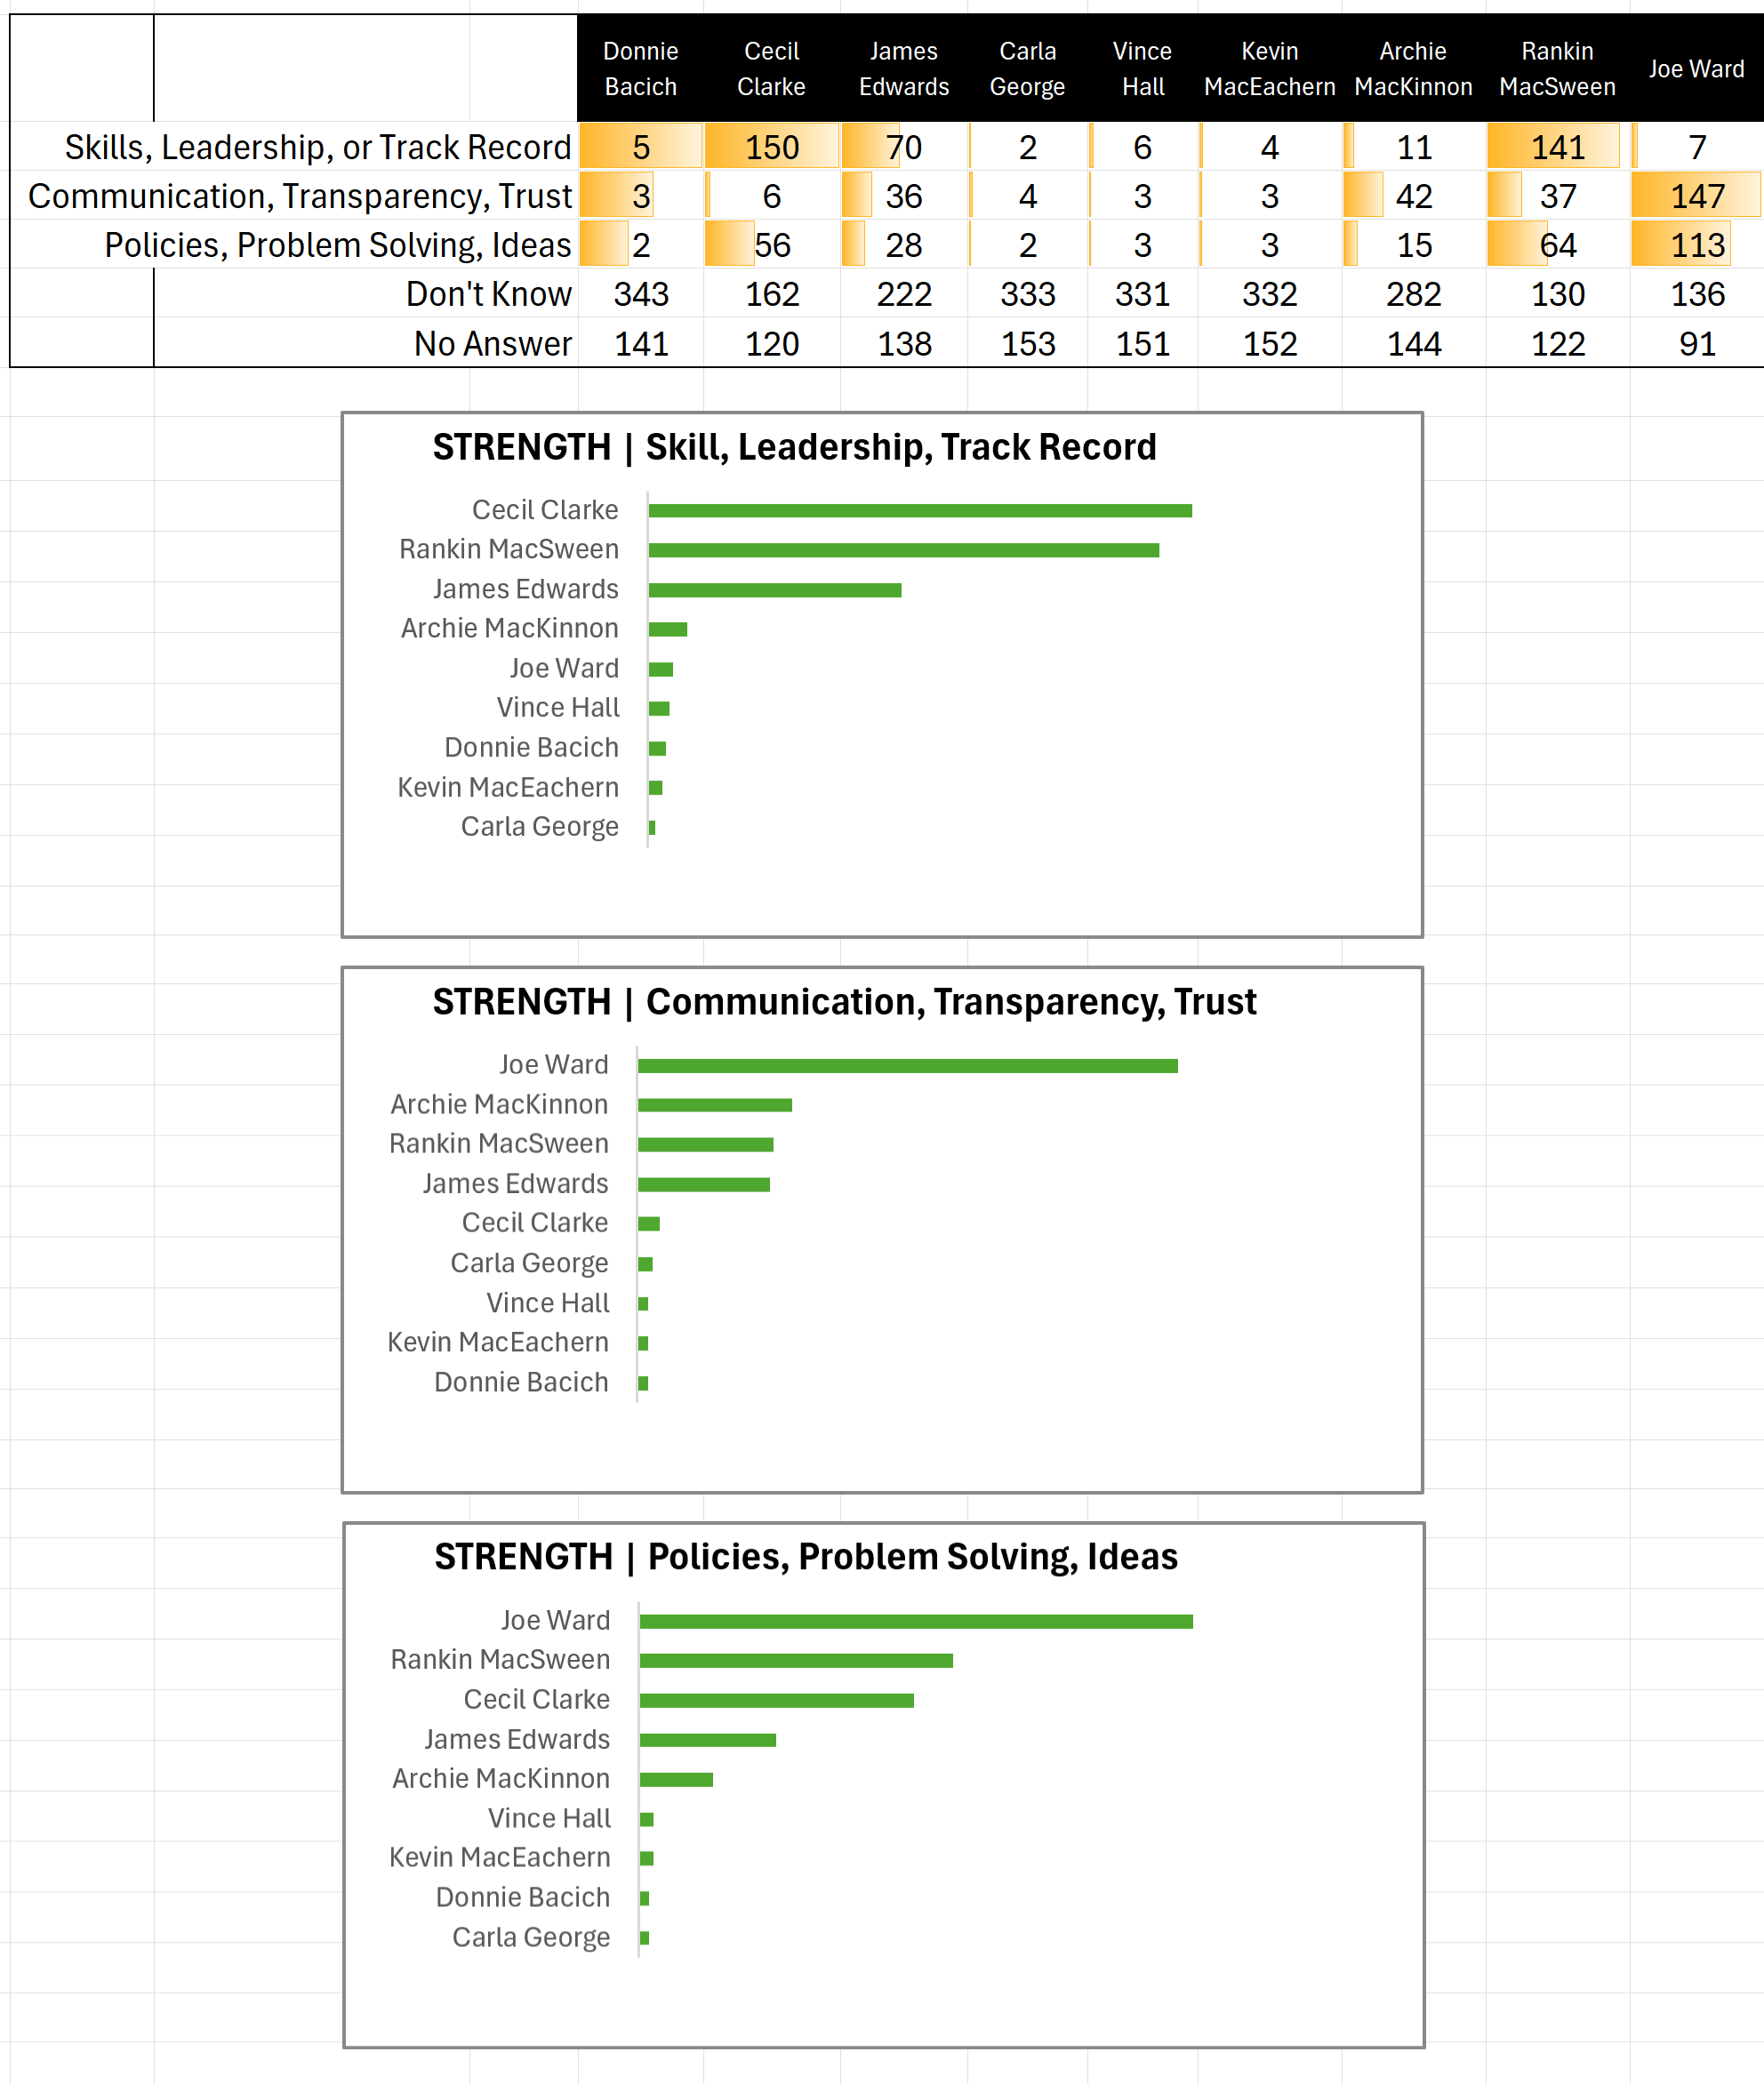
(Q2) Identify each candidate's main STRENGTH
- The data shown here is the total number of responses received for each option. No points are awarded or deducted. The total number of responses are shown in the data table and the bar chart.
- For clarity, scoring HIGH on this is GOOD while scoring LOW is NOT GOOD.

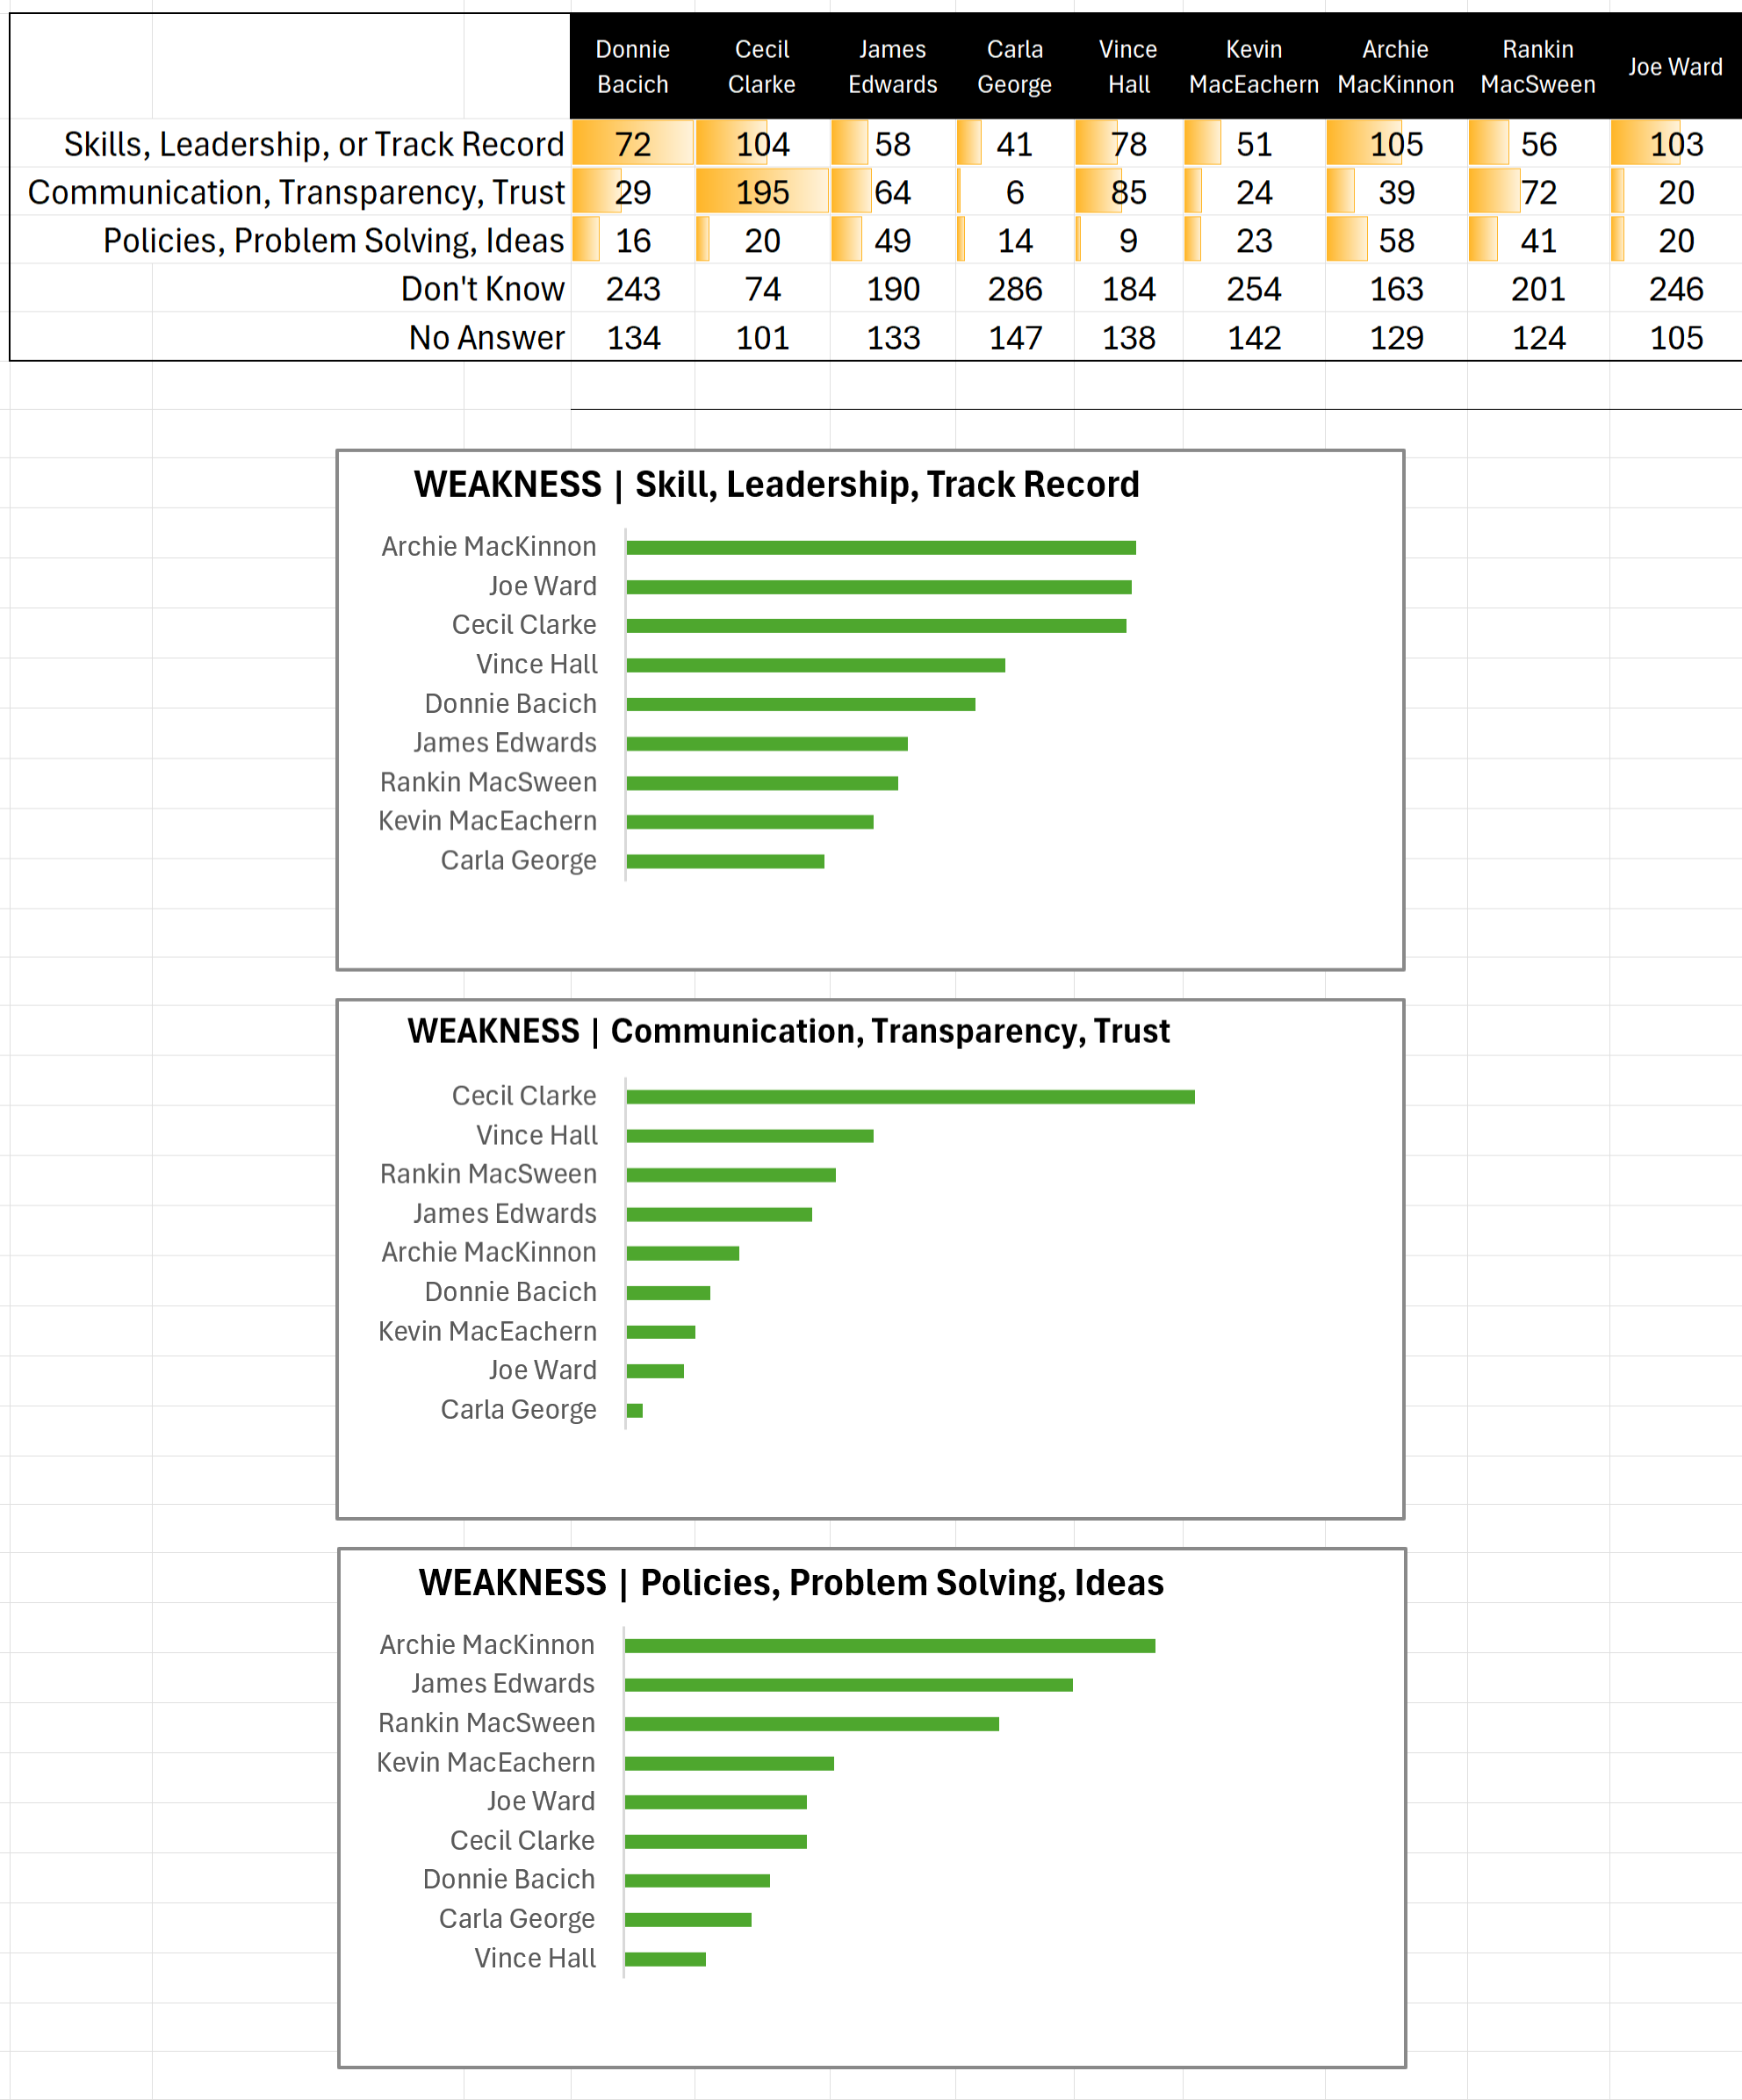
(Q3) Identify each candidate's main WEAKNESS
- The data shown here is the total number of responses received for each option. No points are awarded or deducted. The total number of responses are shown in the data table and the bar chart.
- For clarity, scoring LOW on this is GOOD while scoring HIGH is NOT GOOD.

Final Word
Keep in mind that this is just an opinion poll. If you like, dislike, agree, or disagree with the results, the only true action that makes a difference is your vote during the election — so be sure to vote.
Thoughtful comments and respectful discussion are welcome — all comments will be reviewed before being posted.


20
Log In or Sign Up to add a comment.- 1
arrow-eseek-e1 - 6 of 6 itemsFacebook Comments